阿布云
你所需要的,不仅仅是一个好用的代理。
用Python来绘制分形图(曼德勃罗集、分形树叶、科赫曲线等)

难得的国庆长假就已经在不知不觉中过完了,大家是趁着长假出去玩了一圈呢,还是在家中围观人山人海的旅游景点呢。
今天,小编就教大家来用Python画几幅有趣的图形吧。
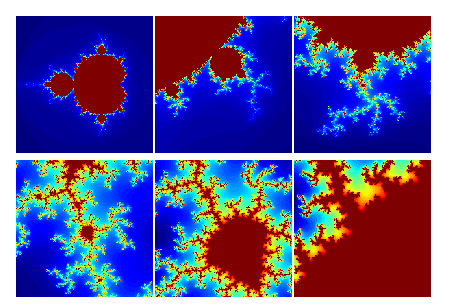
1. 曼德勃罗集
import numpy as np
import pylab as pl
import time
from matplotlib import cm
def iter_point(c):
z = c
for i in xrange(1, 100): # 最多迭代100次
if abs(z)>2: break # 半径大于2则认为逃逸
z = z*z+c
return i # 返回迭代次数
def draw_mandelbrot(cx, cy, d):
"""
绘制点(cx, cy)附近正负d的范围的Mandelbrot
"""
x0, x1, y0, y1 = cx-d, cx+d, cy-d, cy+d
y, x = np.ogrid[y0:y1:200j, x0:x1:200j]
c = x + y*1j
start = time.clock()
mandelbrot = np.frompyfunc(iter_point,1,1)(c).astype(np.float)
print "time=",time.clock() - start
pl.imshow(mandelbrot, cmap=cm.jet, extent=[x0,x1,y0,y1])
pl.gca().set_axis_off()
x,y = 0.27322626, 0.595153338
pl.subplot(231)
draw_mandelbrot(-0.5,0,1.5)
for i in range(2,7):
pl.subplot(230+i)
draw_mandelbrot(x, y, 0.2**(i-1))
pl.subplots_adjust(0.02, 0, 0.98, 1, 0.02, 0)
pl.show()
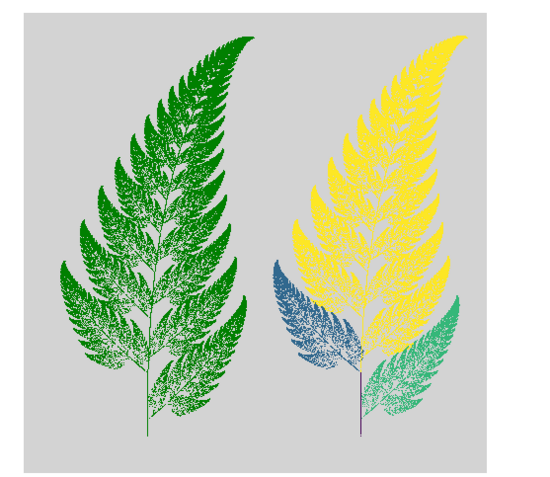
2. 分形树叶
import numpy as np
import matplotlib.pyplot as pl
import time
# 蕨类植物叶子的迭代函数和其概率值
eq1 = np.array([[0,0,0],[0,0.16,0]])
p1 = 0.01
eq2 = np.array([[0.2,-0.26,0],[0.23,0.22,1.6]])
p2 = 0.07
eq3 = np.array([[-0.15, 0.28, 0],[0.26,0.24,0.44]])
p3 = 0.07
eq4 = np.array([[0.85, 0.04, 0],[-0.04, 0.85, 1.6]])
p4 = 0.85
def ifs(p, eq, init, n):
"""
进行函数迭代
p: 每个函数的选择概率列表
eq: 迭代函数列表
init: 迭代初始点
n: 迭代次数
返回值: 每次迭代所得的X坐标数组, Y坐标数组, 计算所用的函数下标
"""
# 迭代向量的初始化
pos = np.ones(3, dtype=np.float)
pos[:2] = init
# 通过函数概率,计算函数的选择序列
p = np.add.accumulate(p)
rands = np.random.rand(n)
select = np.ones(n, dtype=np.int)*(n-1)
for i, x in enumerate(p[::-1]):
select[rands<x] = len(p)-i-1
# 结果的初始化
result = np.zeros((n,2), dtype=np.float)
c = np.zeros(n, dtype=np.float)
for i in range(n):
eqidx = select[i] # 所选的函数下标
tmp = np.dot(eq[eqidx], pos) # 进行迭代
pos[:2] = tmp # 更新迭代向量
# 保存结果
result[i] = tmp
c[i] = eqidx
return result[:,0], result[:, 1], c
start = time.clock()
x, y, c = ifs([p1,p2,p3,p4],[eq1,eq2,eq3,eq4], [0,0], 100000)
time.clock() - start
pl.figure(figsize=(6,6))
pl.subplot(121)
pl.scatter(x, y, s=1, c="g", marker="s", linewidths=0)
pl.axis("equal")
pl.axis("off")
pl.subplot(122)
pl.scatter(x, y, s=1,c = c, marker="s", linewidths=0)
pl.axis("equal")
pl.axis("off")
pl.subplots_adjust(left=0,right=1,bottom=0,top=1,wspace=0,hspace=0)
pl.gcf().patch.set_facecolor("#D3D3D3")
pl.show()
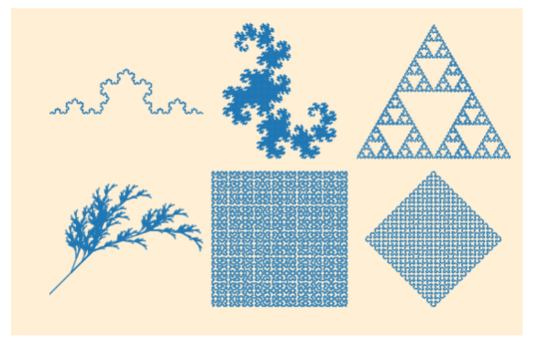
3. 其它分形图(科赫曲线、分形龙、谢尔宾斯基三角等)
from math import sin, cos, pi
import matplotlib.pyplot as pl
from matplotlib import collections
class L_System(object):
def __init__(self, rule):
info = rule['S']
for i in range(rule['iter']):
ninfo = []
for c in info:
if c in rule:
ninfo.append(rule[c])
else:
ninfo.append(c)
info = "".join(ninfo)
self.rule = rule
self.info = info
def get_lines(self):
d = self.rule['direct']
a = self.rule['angle']
p = (0.0, 0.0)
l = 1.0
lines = []
stack = []
for c in self.info:
if c in "Ff":
r = d * pi / 180
t = p[0] + l*cos(r), p[1] + l*sin(r)
lines.append(((p[0], p[1]), (t[0], t[1])))
p = t
elif c == "+":
d += a
elif c == "-":
d -= a
elif c == "[":
stack.append((p,d))
elif c == "]":
p, d = stack[-1]
del stack[-1]
return lines
rules = [
{
"F":"F+F--F+F", "S":"F",
"direct":180,
"angle":60,
"iter":5,
"title":"Koch"
},
{
"X":"X+YF+", "Y":"-FX-Y", "S":"FX",
"direct":0,
"angle":90,
"iter":13,
"title":"Dragon"
},
{
"f":"F-f-F", "F":"f+F+f", "S":"f",
"direct":0,
"angle":60,
"iter":7,
"title":"Triangle"
},
{
"X":"F-[[X]+X]+F[+FX]-X", "F":"FF", "S":"X",
"direct":-45,
"angle":25,
"iter":6,
"title":"Plant"
},
{
"S":"X", "X":"-YF+XFX+", "Y":"+XF-YFY-FX+",
"direct":0,
"angle":90,
"iter":6,
"title":"Hilbert"
},
{
"S":"L--F--L--F", "L":"+R-F-R+", "R":"-L+F+",
"direct":0,
"angle":45,
"iter":10,
"title":"Sierpinski"
},
]
def draw(ax, rule, iter=None):
if iter!=None:
rule["iter"] = iter
lines = L_System(rule).get_lines()
linecollections = collections.LineCollection(lines)
ax.add_collection(linecollections, autolim=True)
ax.axis("equal")
ax.set_axis_off()
ax.set_xlim(ax.dataLim.xmin, ax.dataLim.xmax)
ax.invert_yaxis()
fig = pl.figure(figsize=(7,4.5))
fig.patch.set_facecolor("papayawhip")
for i in xrange(6):
ax = fig.add_subplot(231+i)
draw(ax, rules[i])
fig.subplots_adjust(left=0,right=1,bottom=0,top=1,wspace=0,hspace=0)
pl.show()